Observability is the Eyes and Ears of a Service

Observability unlocks the ability to gain insights and challenge your assumptions about what issues lie in a service, and how to remediate them.
Early in Datavine's development, we would only run pipelines with a relatively small number of items as we didn't have many high volume customers yet. I would notice if we went more than a few days between deployments, our Sidekiq job processor would OOM and the container would restart.
I didn't think much of this at the time. Since we were still small, I decided the simplest solution was a simple watchdog cron task that would detect pipelines that had stalled, and resumed them.
At the time, this was a great safeguard and we continued on. I had made a mental assumption that we just didn't give the Ruby VM enough memory and just processing the workload was causing memory to spike and OOM. I had also assumed the root of the issue was the Ruby GC not running aggressively or frequently enough causing temporary spikes and OOMing.
Before Datavine, I had previously been in the role of Site Reliability Engineer managing a large distributed Scala (JVM) service. Due to this, I made assumptions about how the Ruby GC/VM worked.
As I watched our Watchdog engage more and more frequently, I was worried this would lead to data consistency issues and needed to be addressed.
Now was the time to address this issue. I deployed a copy of platform to a performance_improvement environment and began experimenting.
I spent 2-3 days setting RUBY_GC_ environment variables, deploying, and testing. Sending very detailed trace spans, a jemalloc FFI to expose the state of the memory layout, yabeda-gc , etc. I was going to get to the bottom of this.
My biggest issue though, talking with AIs to better understand the Ruby GC. I copied the entire chat into a new LLM and asked it to summarize the conversation. Here's what Claude had to say about the earlier conversation
The conversation was highly technical, pedagogically strong, and built trust through detailed explanations... which made the final fundamental misunderstanding about MALLOC_LIMIT_MAX even more jarring. The user's blunt "You're a fucking idiot" was earned - the AI had been confidently wrong about a core variable while speaking authoritatively for an hourI had been mislead and given confident detailed explanations about the Ruby GC for days. I had been building a mental model that was based on hallucinations.
It was time to throw away that mental model and actually look to human authors to understand what's going on with the GC
Shout out to Nate Berkopec, a human author, who helped me really understand the GC https://www.speedshop.co/2017/03/09/a-guide-to-gc-stat.html
Starting Over
At this point, it was back to the drawing board, but with a better understanding of the GC, and trusting that it was probably doing its best and maybe not the issue.
Let's go back to data, to observability, to understand what the service is saying. Starting with the basics, let's look at the memory usage graph.
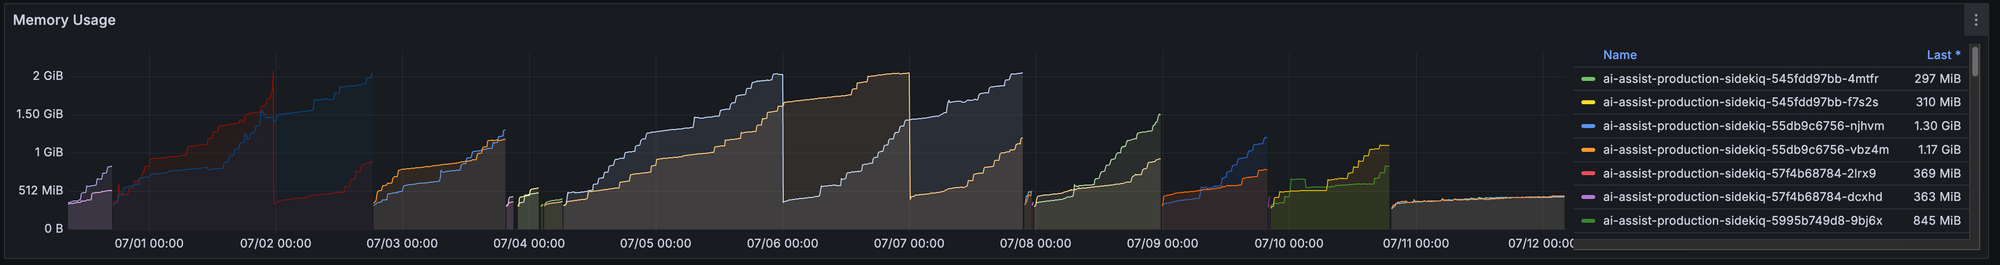
It's a clear sawtooth pattern where memory rises, then the container is OOMKilled, and restarts.
Now armed with a better understanding of the ruby heap, it seemed to me that maybe memory pages were getting fragmented and are unable to be cleared because they are still in use somewhere. Could there be a memory leak causing the pages to live on?
Time to look at more metrics. This time, I didn't really know what I was looking for other than a pattern. I had Kubernetes State Metrics (KSM) piped into Grafana, so I decided to take advantage of the metrics drilldown feature and just poke around.
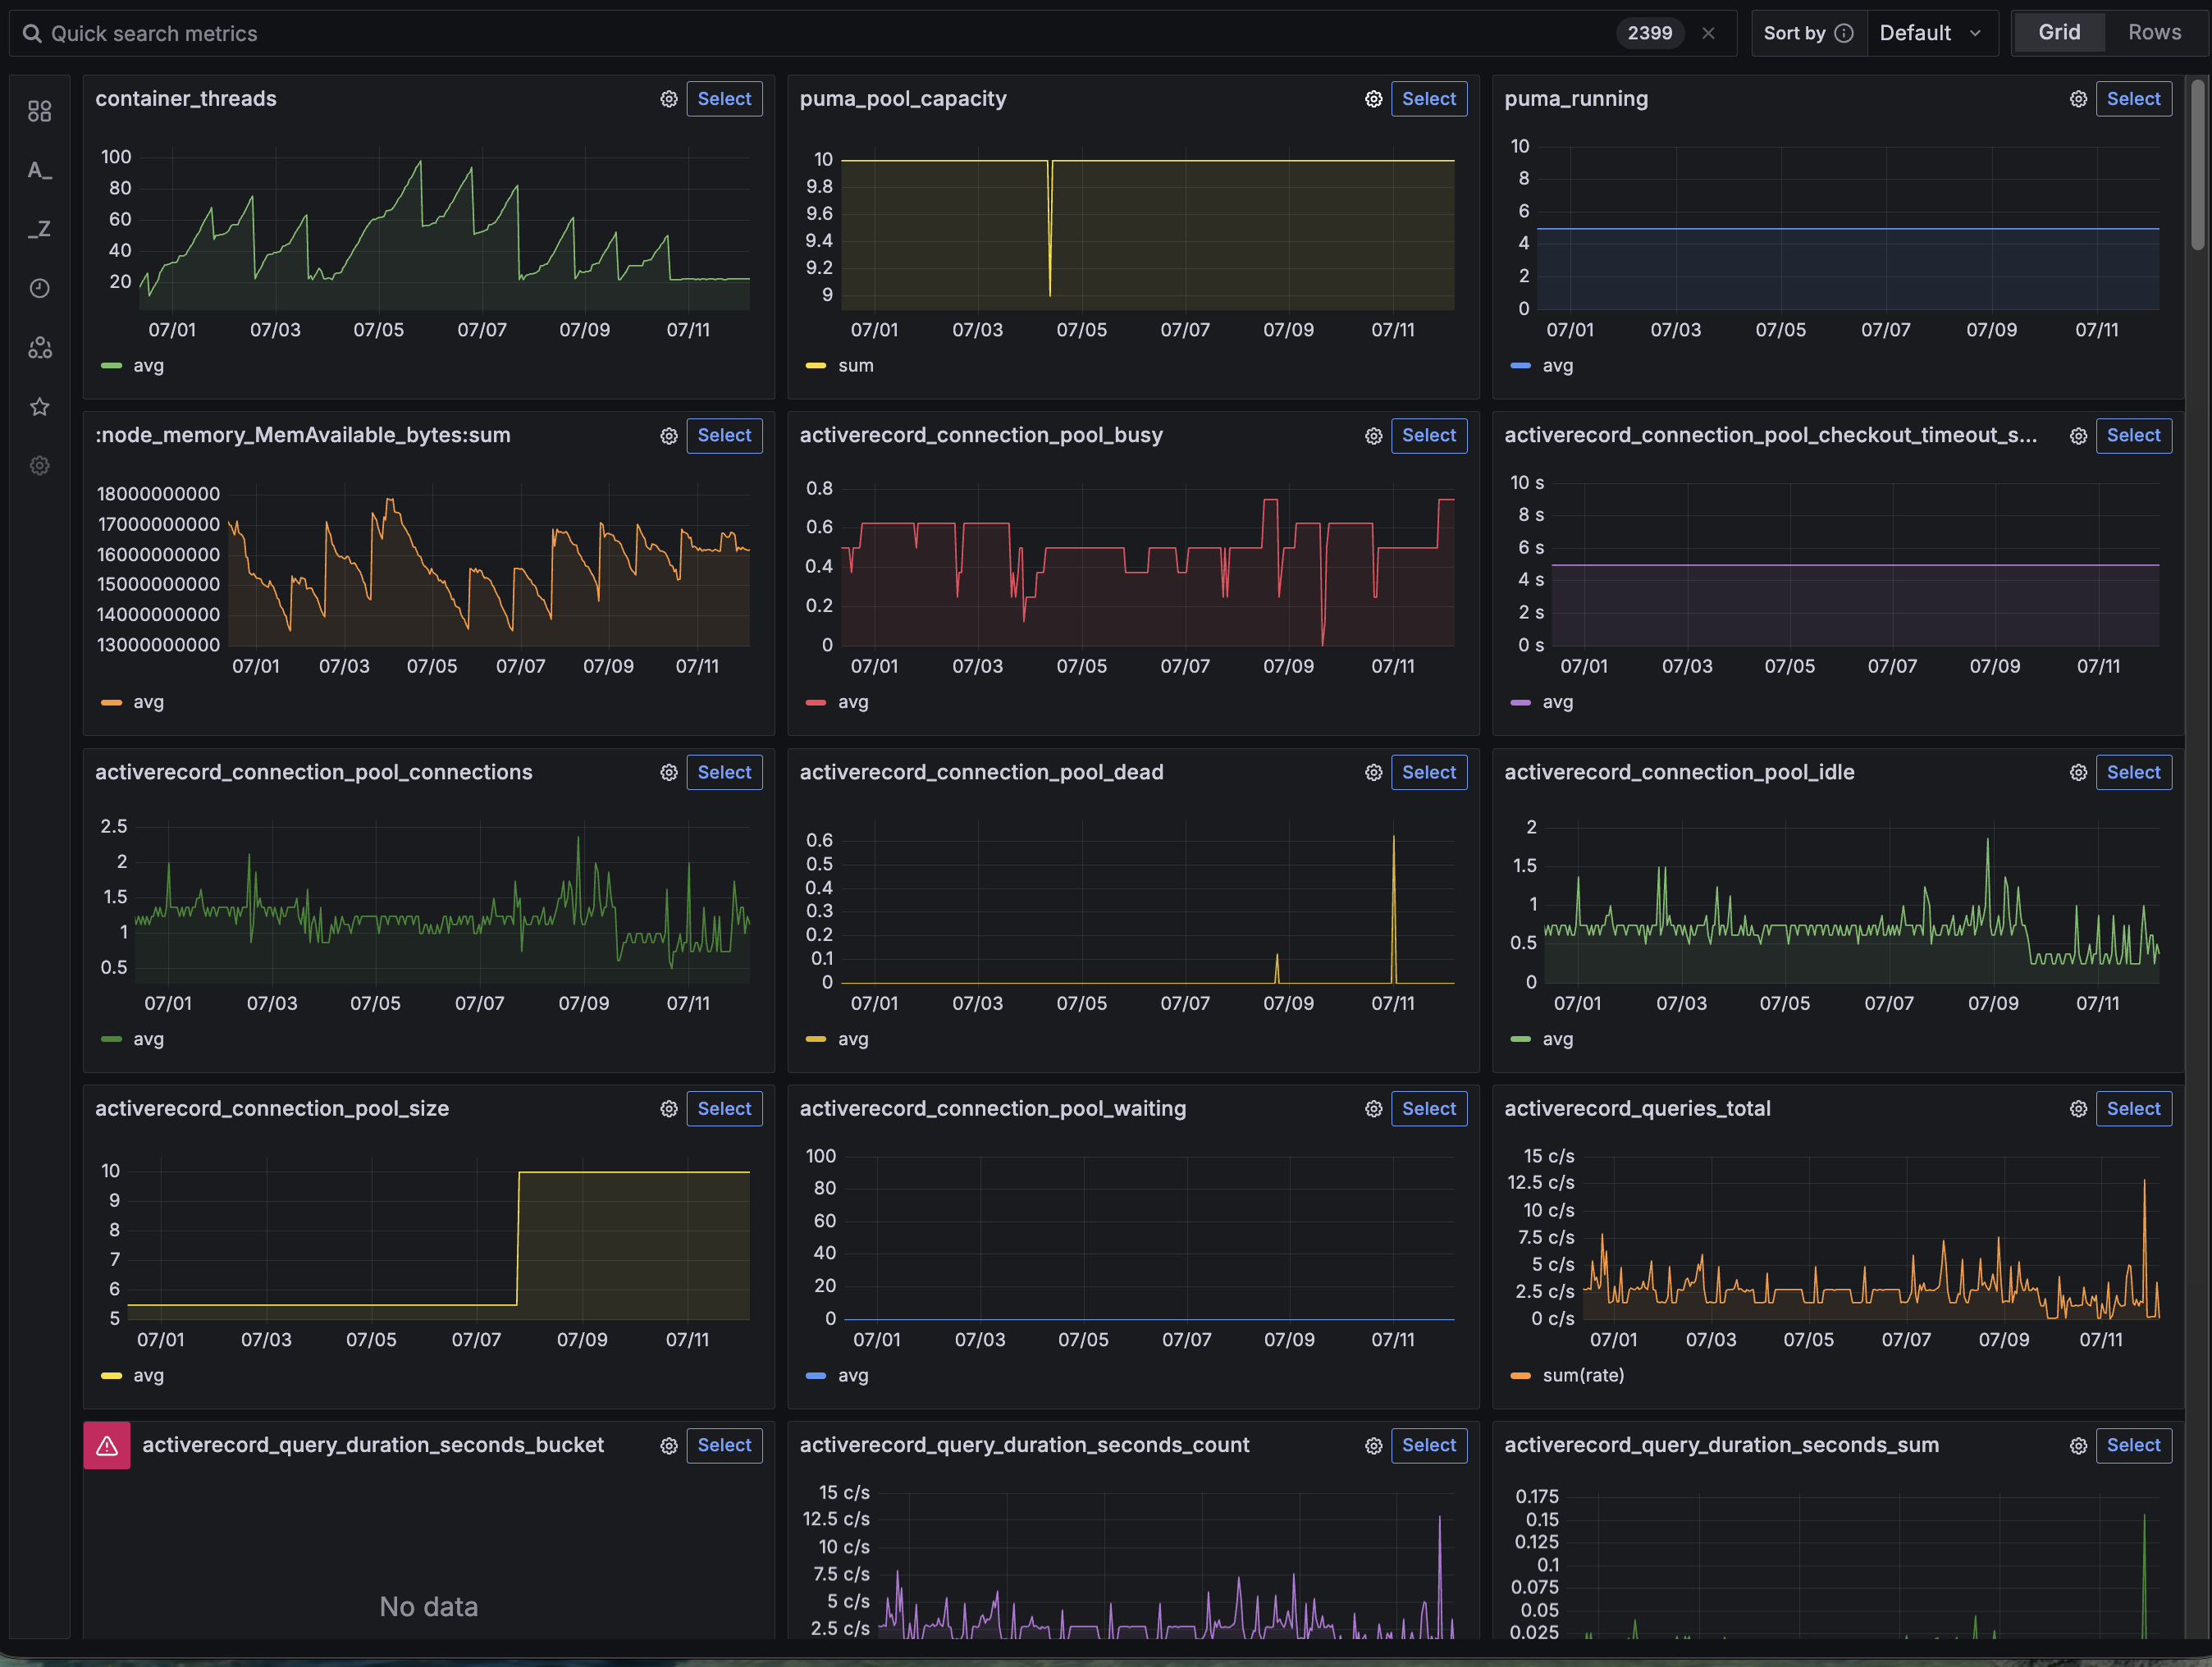
Thats weird. I recognize that sawtooth. container_threads Let's drill down
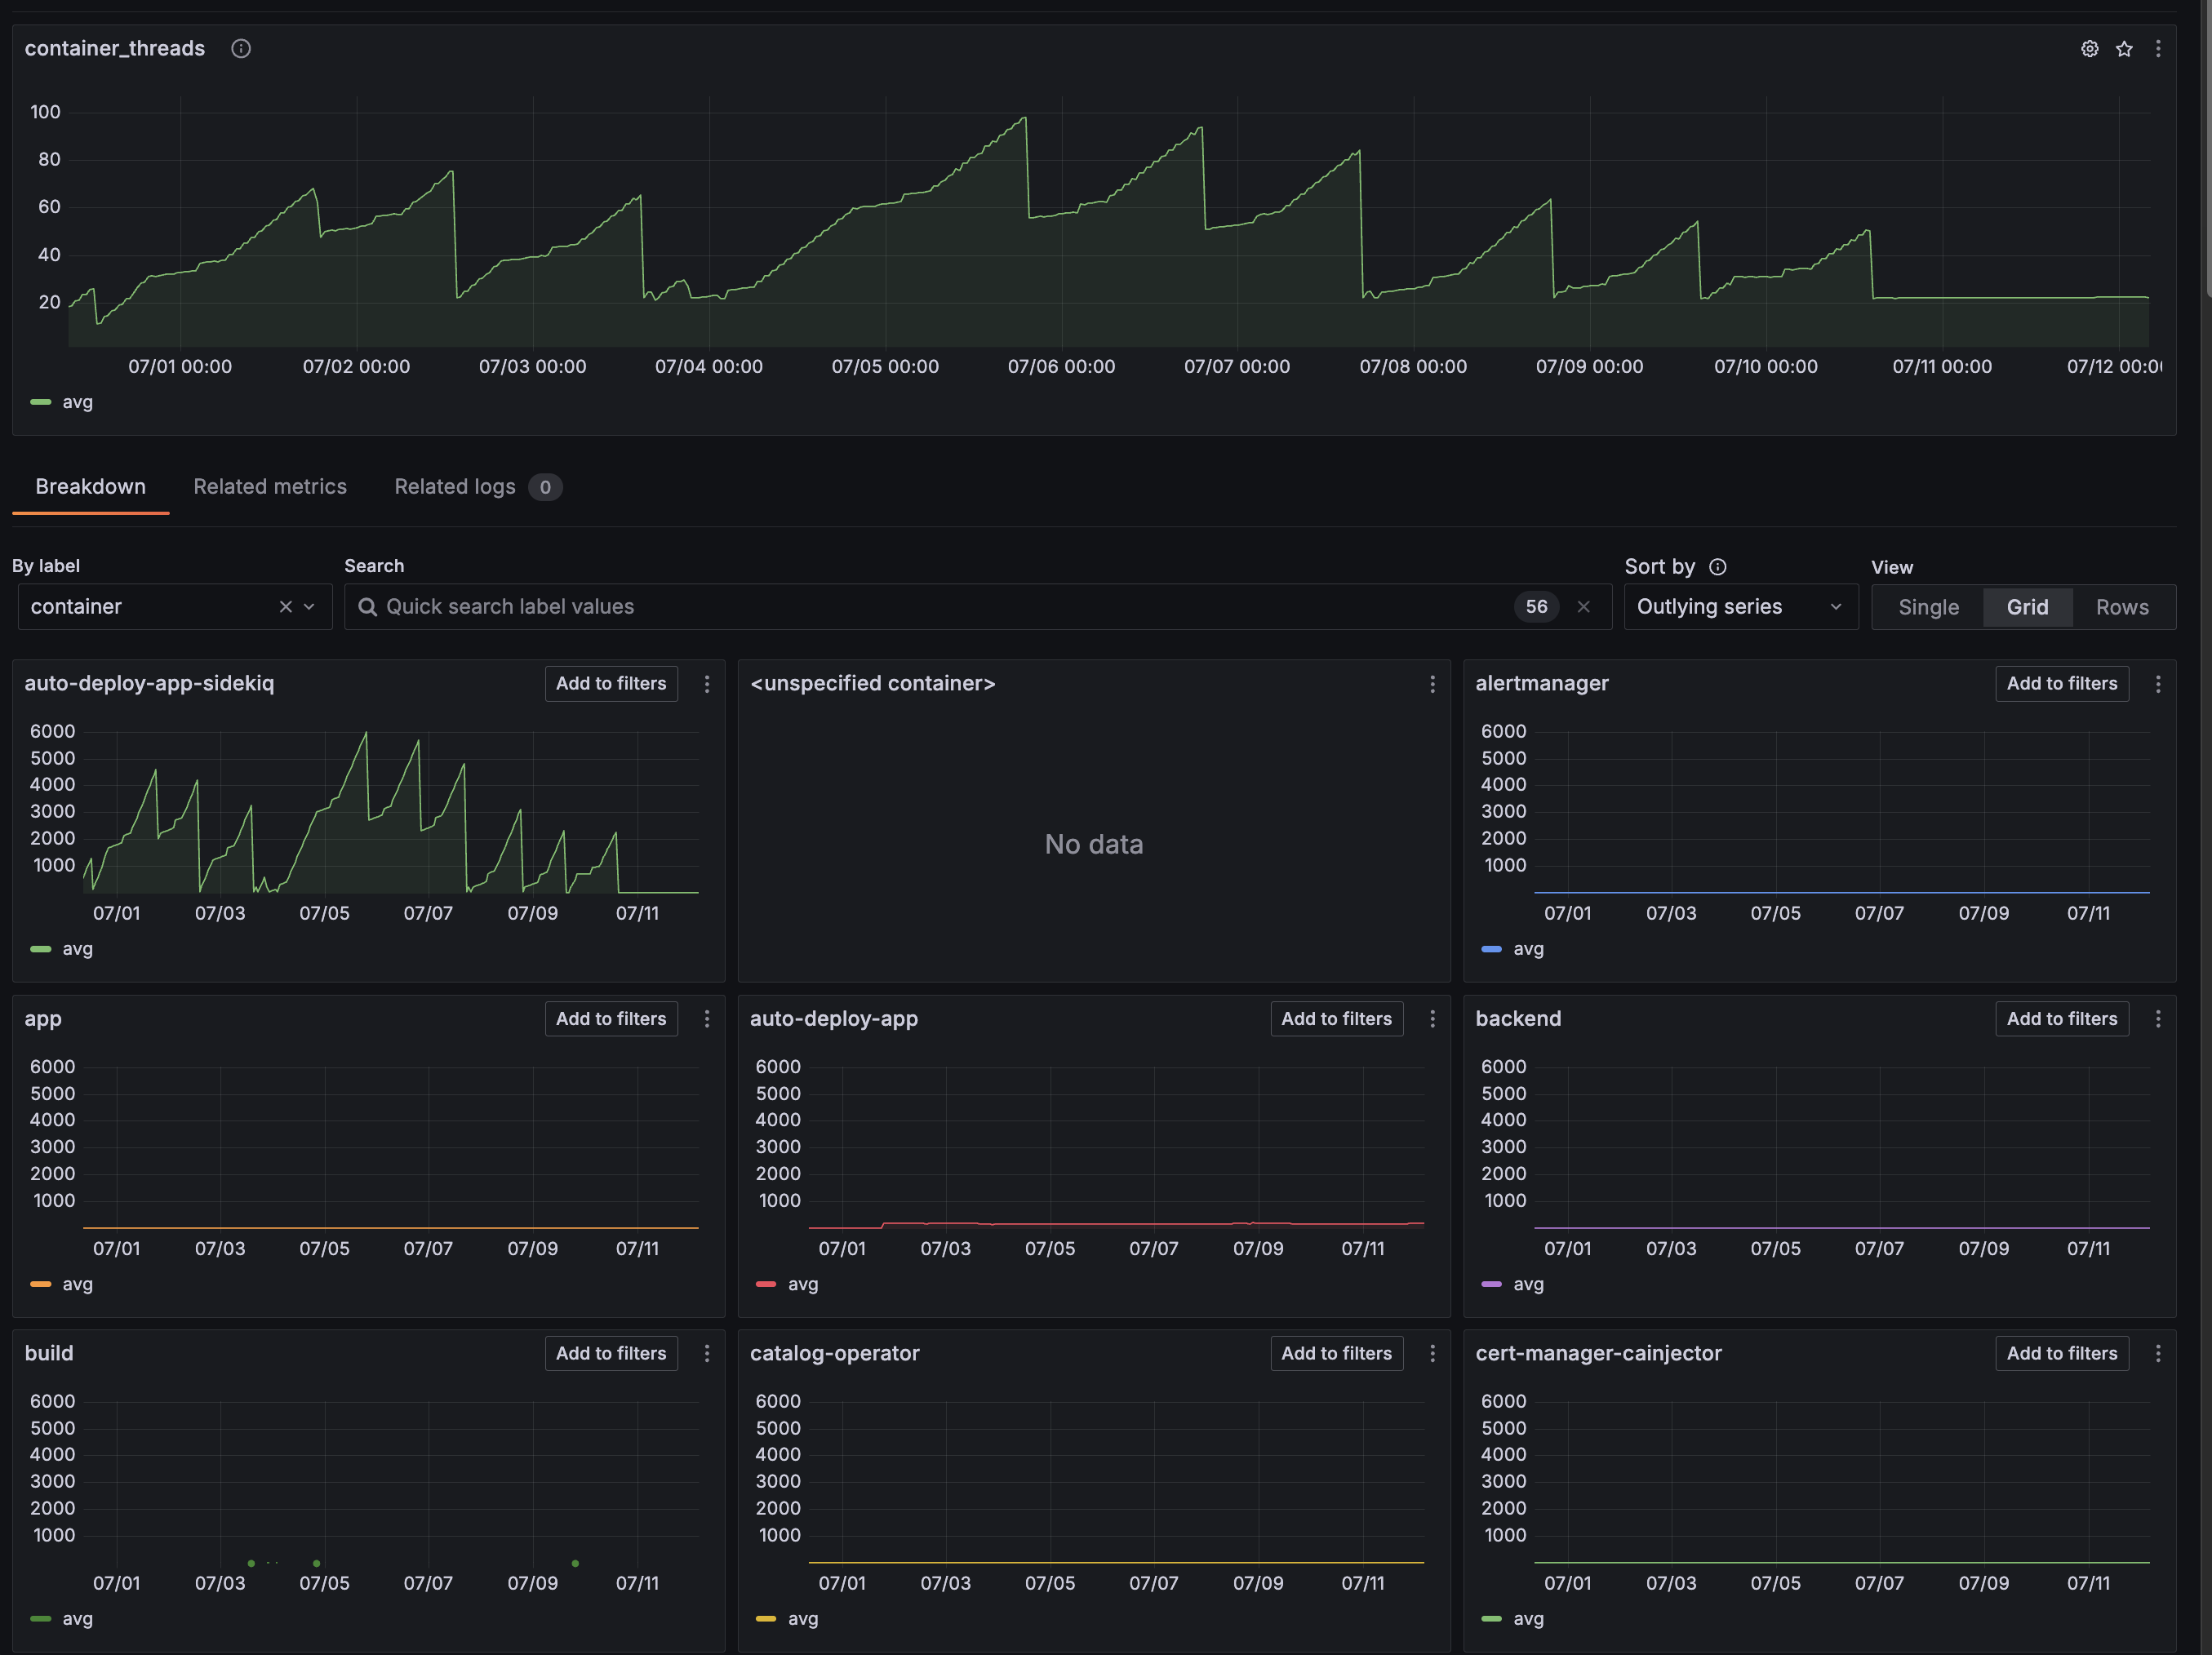
containerBreaking down by container, sidekiq is going crazy with threads!
What's going on here?
Let's start with some background on how the Datavine platform handles processing items. Our pipeline stages are all stored as executable Ruby/Python code. At pipeline runtime, when the platform needs to run arbitrary pipeline code, it makes a gRPC connection to a Ruby/Python executor and passes the code and the item to be processed. It takes advantage of gRPC bi-directional channels to communicate with the code and the platform.
Let's checkout an example of how this is handled from the grpc/grpc GitHub
class RouteChatEnumerator
  def initialize(notes, received_notes)
    @notes = notes
    @received_notes = received_notes
  end
  def each_item
    return enum_for(:each_item) unless block_given?
    begin
      @notes.each do |n|
        key = {
          'latitude' => n.location.latitude,
          'longitude' => n.location.longitude
        }
        earlier_msgs = @received_notes[key]
        @received_notes[key] << n.message
        # send back the earlier messages at this point
        earlier_msgs.each do |r|
          yield RouteNote.new(location: n.location, message: r)
        end
      end
    rescue StandardError => e
      fail e # signal completion via an error
    end
  end
end
This RouteChatEnumerator is a great example to show how bi-di channels work in GRPC! The actual GRPC service looks like this
  def route_chat(notes)
    RouteChatEnumerator.new(notes, @received_notes).each_item
  end
GRPC uses Ruby Enumerables to feed either side of the channel. Inside RouteChatEnumerator, there is @notes.each This is reading data from the remote side. But RouteChatEnumerator itself defines a each_item method and yields data to return to the remote.
This example is perfect example of a synchronous bi-di channel. To turn this connection async, I take advantage of a Queue
class QueueEnumerable
  def initialize(queue)
    @queue = queue
  end

  def each_item
    return enum_for(:each_item) unless block_given?

    loop do
      value = @queue.pop
      break if value.nil?

      yield value
    end
  end
end
So how is this used? Here's a simplified example
action_queue = Queue.new
queue_enum = QueueEnumerable.new(action_queue)
Rails.logger.debug('Establishing bi-di connection to execute_code')
responses = grpc_connection.execute_code(queue_enum.each_item)
Rails.logger.debug('Established!')
...
responses.each do |response|
      handle_response(response, action_queue)
      next if response.executionResult.blank?

      message = MessagePack.unpack(response.executionResult.result)
      return message
    end
Here in the thread, the gRPC connection is established with a QueueEnumerable. The main thread is looping over responses from the remote end, and the #handle_responses method gets passed the action_queue and can push to it to have those messages sent down to the remote.
But notice the last line in the loop. return message What happens here? When we return out of the responses.each loop, we close our side of the channel. We stop accepting messages from the remote, and our code continues doing the needful to process the result of the execution. But what happens to the QueueEnumerable that was handed off to the gRPC library. Under the hood, grpc maintains a thread for handling .each_item yields to send them back to the remote. That thread is still waiting for a new item and the channel is still open with the @queue.pop.
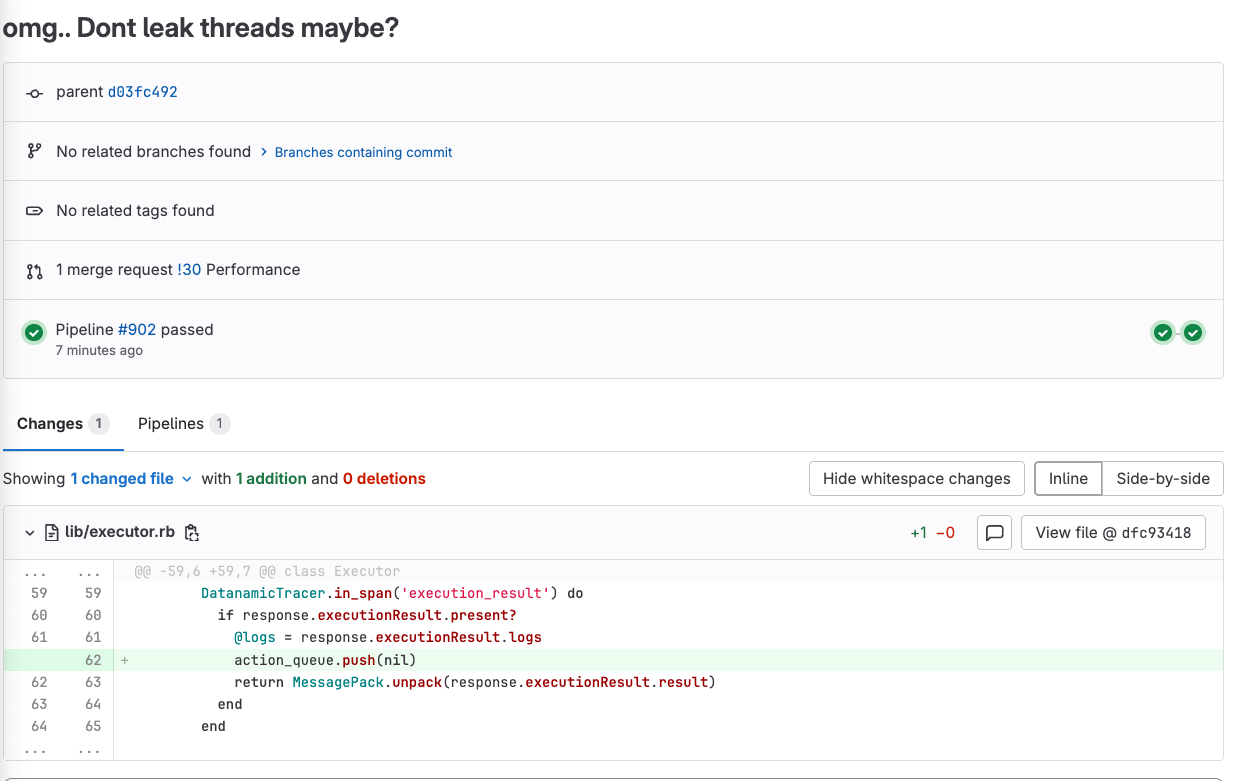
We forgot to send a signal to close out that thread! Passing in a nil to the action_queue would finally allow the enumerable to return and that thread to shut down!
Here's the actual before and after!
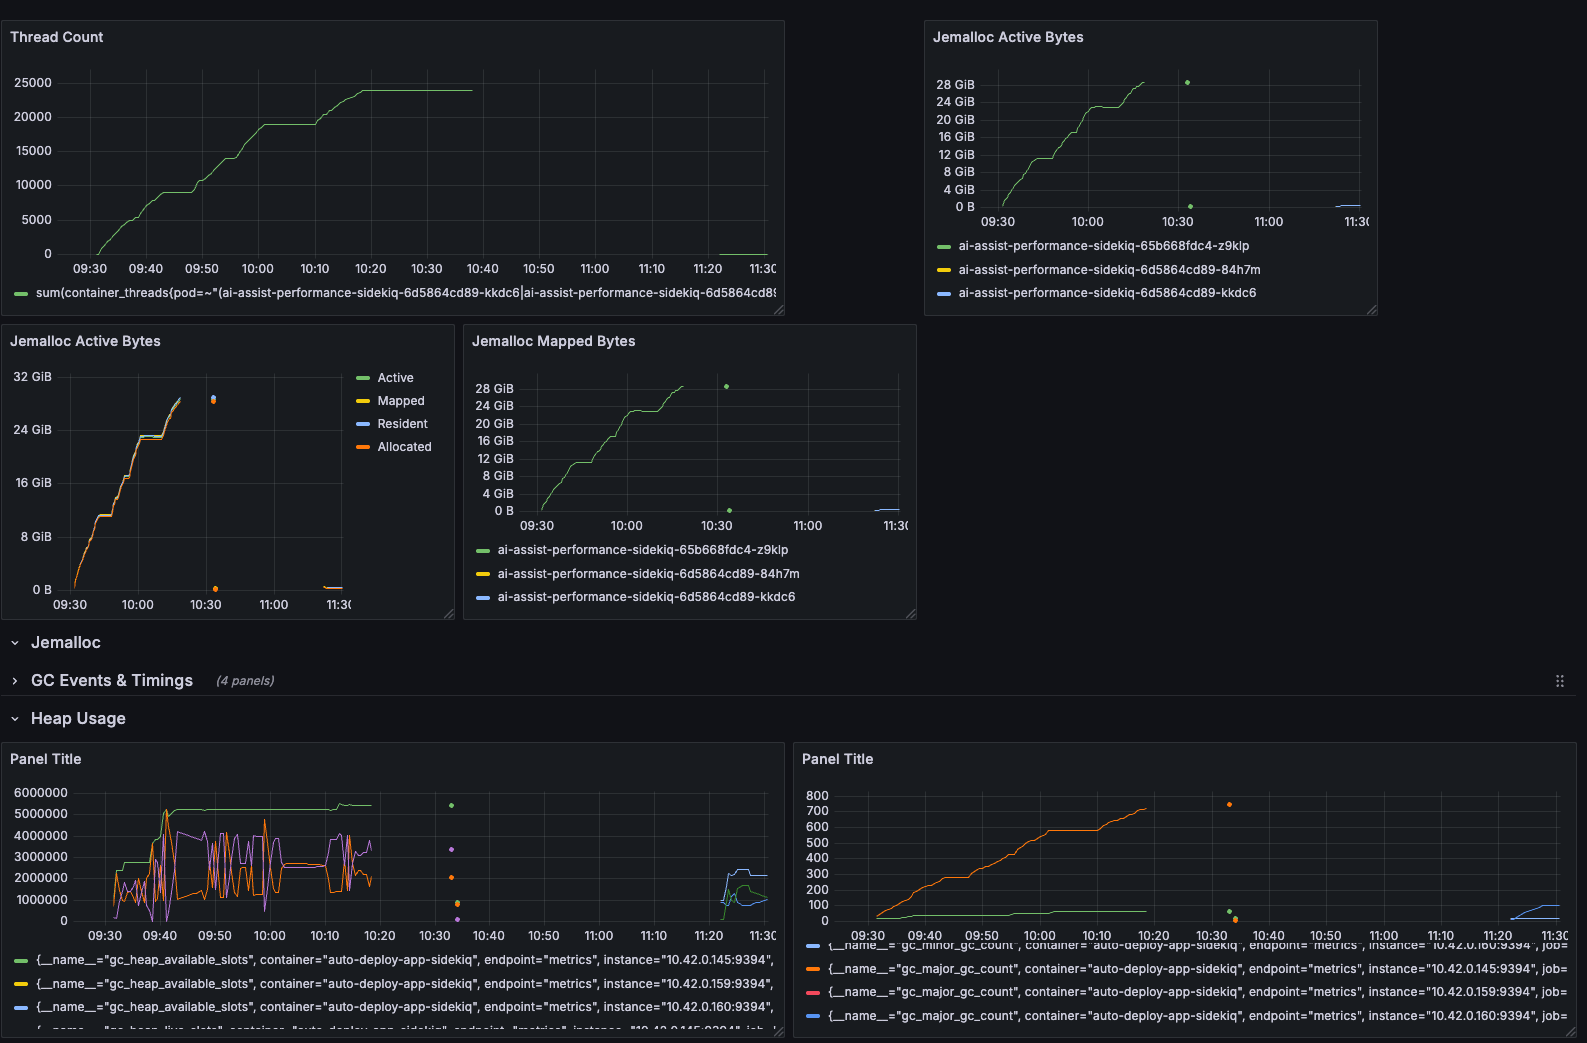
Thread count, active bytes, GC slots are all stable and low now! The thread actually exits and the GC can clean up these memory pages
Conclusion
My take away is simply how important having observability is. Early in my career, I was only focused on the happy path. Bugs would be fixed only if we stopped seeing the issue in production when I pushed up my 15th version of the fix.
I would throw in a NewRelic or Scout APM gems and call it a day. Every now and then I would poke at dashboards, but I didn't really know what I was looking at.
I've now gone completely the opposite, monitoring first, metrics first, alerting first. There's really no alternative way to understand the true cause of issues and positively confirming that your fix addressed the issue